Case Study – Earth-Air Heat Exchanger Model
The challenge
Polypipe Civils have developed a range of reinforced polyethylene pipes for use as
earth-air heat exchangers. They and their partners WSP require a software tool to
calculate the heating and cooling benefits of a heat exchanger made from the pipes
hour-by-hour using hourly air temperature data for locations across the UK and for
a range of soil types.
The solution
Atkinson Science created a software tool for Polypipe Civils and WSP which
calculates hourly and yearly cooling benefits in seconds. The user interface is
intuitive and familiarisation takes only a few moments. The interface has six tabs
and the user works from left to right entering information into the tabs.
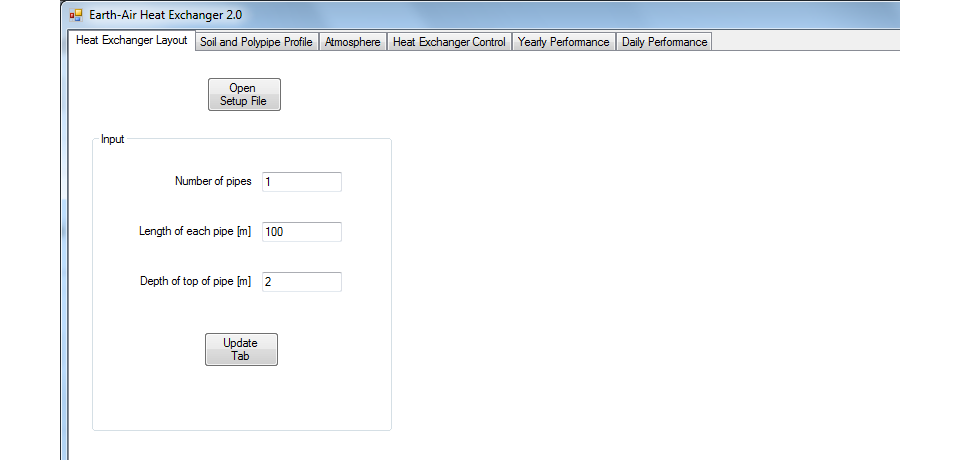
On the first tab (Figure 1) the user can either import a set-up file containing all
the information for a complete earth-air heat exchanger or begin a new design by
entering the length, depth and number of pipes. The user clicks the Update button
to save the information in computer memory.
Figure 1 Heat Exchanger Layout tab
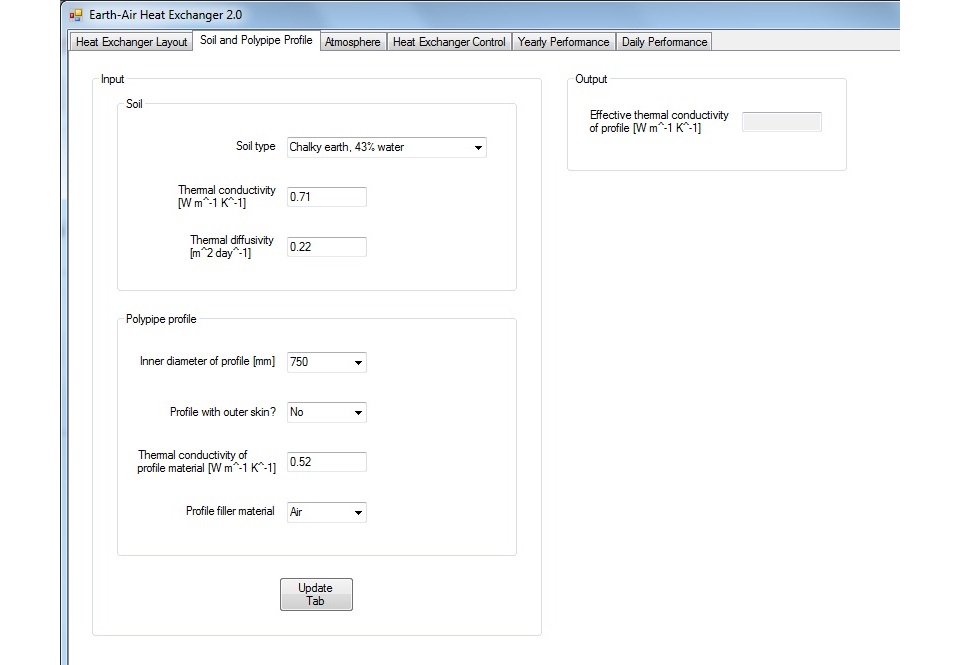
On the second tab (Figure 2) the user selects the soil type, the inner diameter of
the pipe from the Polypipe range, and the type of reinforcement around the outside
of the pipe. When the user clicks the Update button the software tool calculates
the effective thermal conductivity of the pipe and reinforcement.
Figure 2 Soil and Polypipe Profile tab
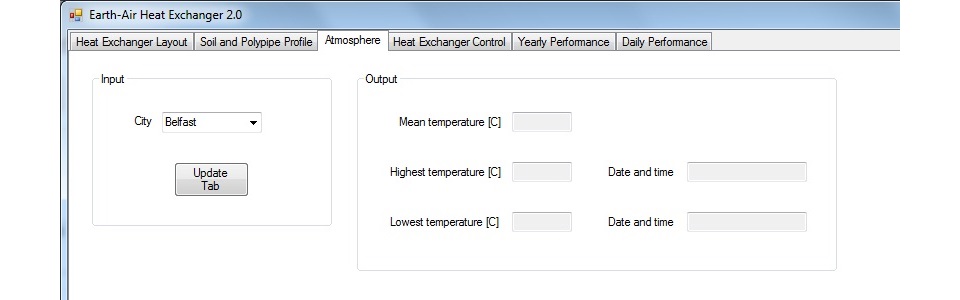
On the third tab (Figure 3) the user selects the hourly temperature data from a
database. The database contains data for thirteen cities across the UK. When the
user clicks the Update button the software tool reads in the hourly temperature
data for the chosen city and computes some basic statistics (the mean, maximum and
minimum air temperatures and the date and time at which the maximum and minimum
occur).
Figure 3 Atmosphere tab
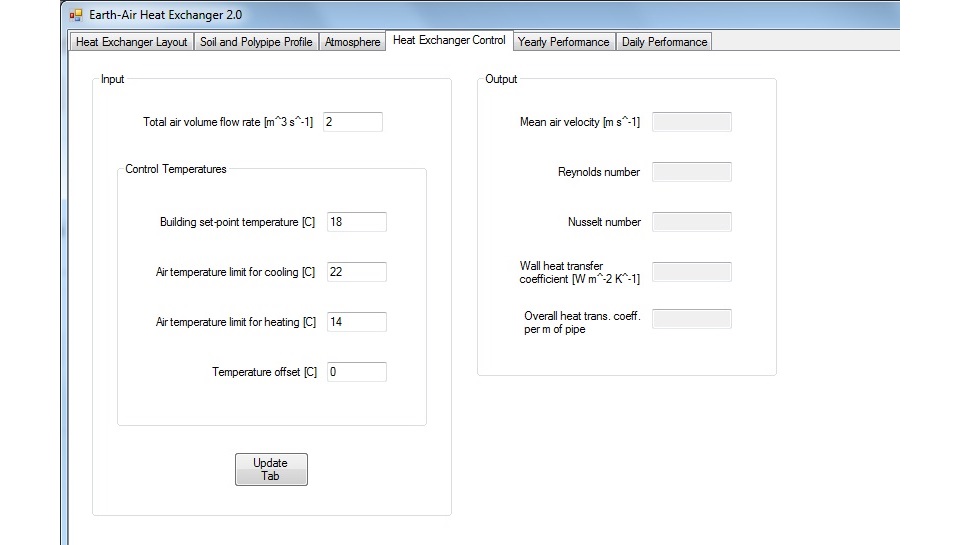
On the fourth tab (Figure 4) the user enters the air volume flow rate, the building
set-point temperature, and the rules by which the fan switches itself on or off in
accordance with the set-point temperature, the atmospheric air temperature and the
heat exchanger outlet temperature. When the user clicks the Update button the
software tool calculates some basic flow and heat transfer information, such as
the Reynolds number and the Nusselt number of the pipe flow and the wall heat
transfer coefficient.
Figure 4 Heat Exchanger Control tab
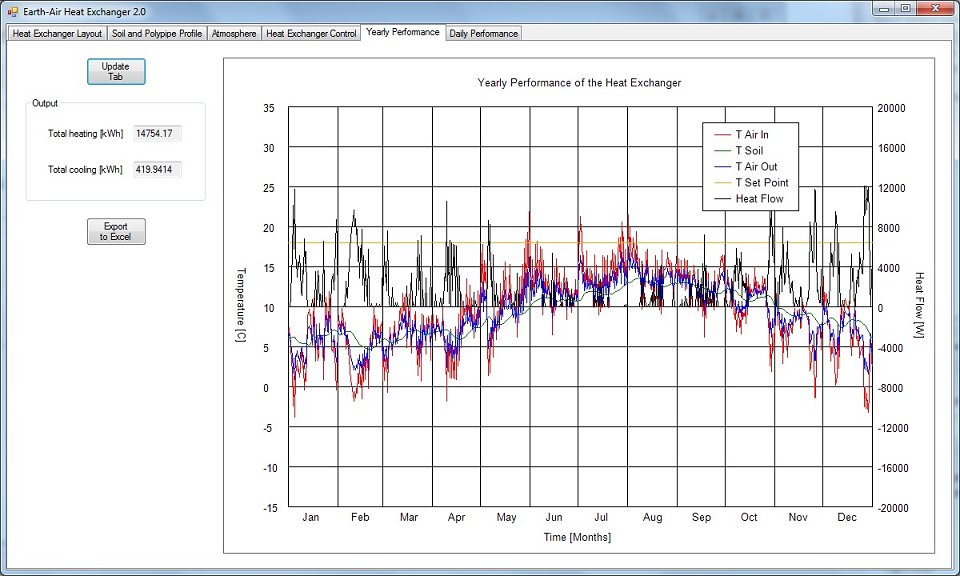
The fifth tab (Figure 5) displays the yearly performance of the heat exchanger.
When the user clicks the Update button the software tool uses the input entered
into the previous tabs to calculate the soil temperature, the air outlet
temperature, and the total heat flux to or from the heat exchanger hour-by-hour
for a whole year. The tool integrates the heat flux over periods of heating and
cooling to give the heating and cooling benefits in kWh and displays them in two
text boxes.
Most of the area of the tab is taken up with a chart displaying curves of
temperature and heat flux. The air inlet temperature is indicated by the red
curve, the soil temperature by the green curve, the air outlet temperature by the
blue curve, the building set-point temperature by the orange horizontal line, and
the heat flux by the black curve. If the control criteria entered on the fourth
tab cause the heat exchanger to switch off at any time then the black curve will
go to zero. However, the air outlet temperature will continue to be calculated and
displayed as the blue curve as though the heat exchanger were still operating. By
continuing to display the blue curve during these periods the user will be able to
see that the change in air temperature through the heat exchanger does not justify
its use.
Figure 5 Yearly Performance tab
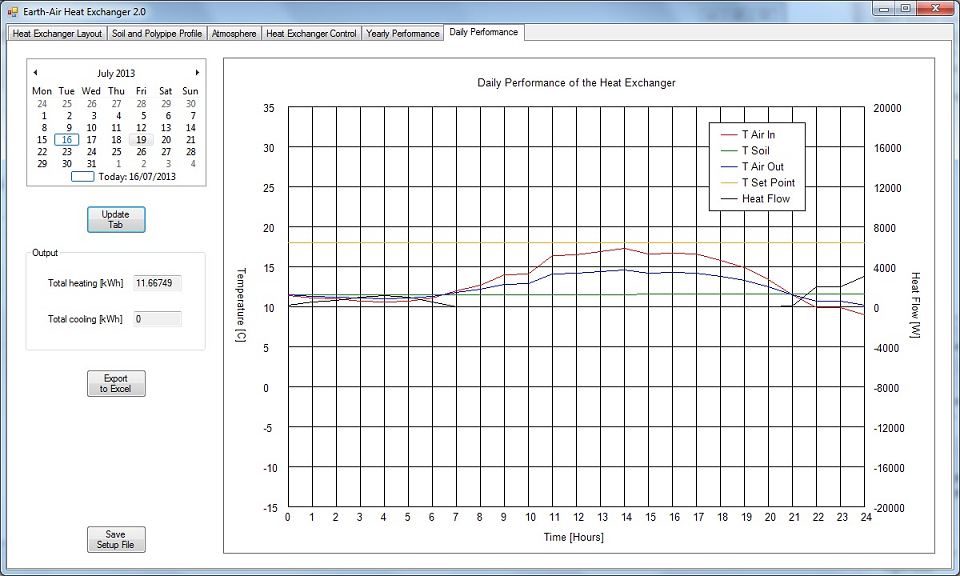
The sixth tab (Figure 6) displays one day’s worth of data out of the 365 days of
data already computed. The user selects the date from a calendar and clicks the
Update button to display the data on a chart. The heating and cooling benefits in
kWh over the 24-hour period are displayed in two text boxes.
Figure 6 Daily Performance tab
The benefits
The software tool enables Polypipe Civils and WSP to design an earth-air heat
exchanger based on Polypipe’s reinforced pipes, set the criteria to control its
operation, and calculate the heating and cooling benefits hour-by-hour when it is
operational. By comparing these benefits with the running costs of the heat
exchanger and the cost of installation and maintenance they can determine whether
the heat exchanger is a worthwhile investment.