Case Study – Infiltration in a Raw Materials Warehouse
The challenge
A warehouse contains raw materials used in the manufacture of pharmaceutical
products. The temperature in the warehouse must remain between 17°C and 25°C and
the relative humidity must remain between 35% and 65%. A measurement survey showed
that in winter the lower temperature and humidity limits were being breached at
the bottom of the storage racks close to the east corner of the warehouse.
Draughts of cold air could be felt at floor level in this corner. The
air-conditioning system was becoming dilapidated. The warehouse owner needed to
know whether the air-conditioning system was (a) no longer working properly and
in need of replacement or (b) perfectly serviceable and being overwhelmed by a
leaky building. Atkinson Science was asked to devise a programme of testing and
computations to determine the most cost-effective way of bringing the warehouse
back into compliance with the T and RH specifications.
The solution
Atkinson Science devised a programme of work designed to show whether the existing
air-conditioning system was simply being overwhelmed by infiltration. If a
building is very leaky then replacing the air-conditioning system may produce no
benefit and be a costly mistake. The programme consisted of:
- A leakage survey to identify potential leakage paths into the warehouse;
- An air-tightness test conducted by BSRIA to determine the characteristic
leakage curve of the warehouse;
- Estimation of the location and extent of leakage flows from the results of
(a) and (b);
- Creation of a CFD model of the warehouse incorporating the leakages and the
existing air-conditioning system. Validation of the model using the results of
the measurement survey;
- Using the validated model to see whether a proposed new system would make an
improvement when faced with the leakages.
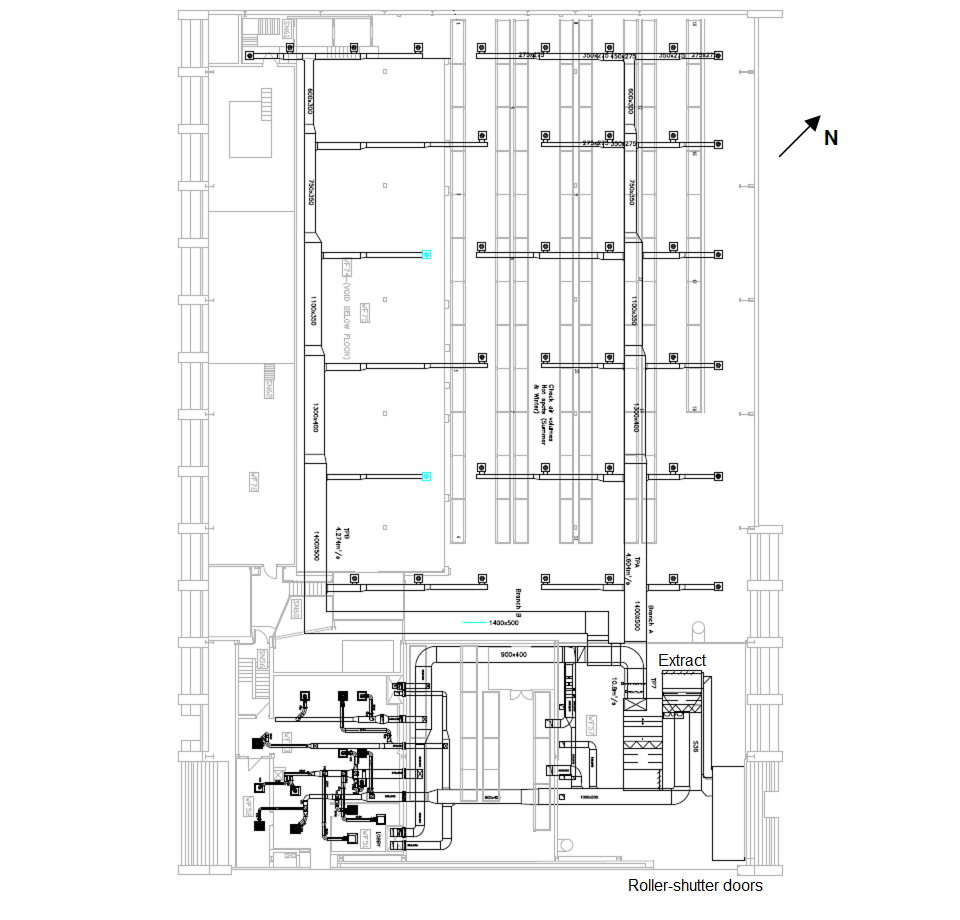
The warehouse is shown in plan view in Figure 1. The warehouse has a floor area of
54 m × 38 m and a height of 10 m. The storage racks occupy only a third of the
floor area. The rest of the space is taken up with offices. The storage area is
ventilated by high-level diffusers, which are shown in Figure 1. There is a single
extract vent, which is also shown. Goods are moved in and out of the warehouse
through the roller-shutter doors at the east corner of the warehouse. The leakage
survey identified numerous potential leakage sites. However, there were two sites,
in particular, that were draughty and were clearly allowing in large volumes of
air. The first was the join between the northeast wall and the concrete floor and
the second was the bottom of the roller-shutter doors. The air-tightness test
returned an air permeability Q50/Sp of 6.74
m3 h−1 m−2. According to CIBSE TM23:2000, this
value represents good practice for large industrial buildings, but not best
practice, which would require Q50/Sp to be
3.5 m3 h−1 m−2 or less. From the characteristic
leakage curve the effective leakage area (EFA) was found to be
1.07 m2.
Fig 1 Plan of the raw materials warehouse
Leakages into a building can be caused by wind pressures on the building or by the
difference in the internal and external temperatures (the stack effect). The stack
effect will be greatest in winter and summer when the temperature difference is
greatest and the taller the building the greater the stack effect. In winter, cold
air will enter the building through openings at low level and warm air will leave
through openings at high level. The draughts in the east corner of the warehouse
were at floor level and were detected on a calm day in January, so we concluded
that the draughts were being caused by the stack effect. The measurement survey
showed that in winter the lower temperature and humidity limits were being
breached at the bottom of the storage racks close to the East corner of the
warehouse. These breaches are consistent with our conclusion that cold air was
entering the warehouse at floor level under the stack effect.
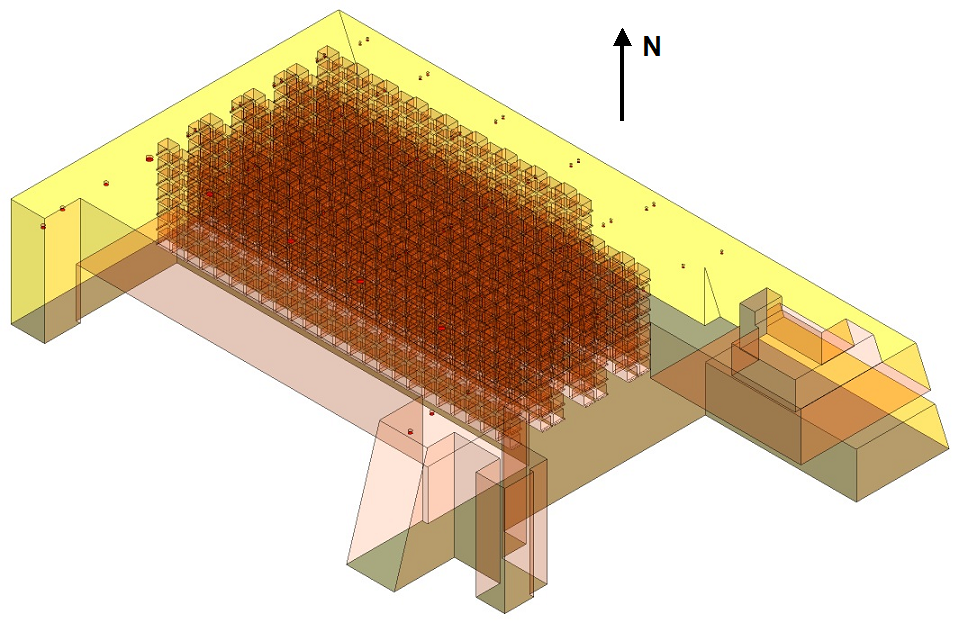
We built a CFD model of the warehouse with the ventilation provided by the existing
system. Figure 2 shows the computational domain. We distributed half the leakage
area along the bottom of the northeast wall and the bottom of the roller-shutter
doors and half along the wall at roof level. Assuming there was no wind pressure
on the building, we calculated that 2.1 kg s−1 of air was entering the
warehouse at low level and leaving at high level. Over the two-week period of the
measurement survey the lowest outside temperature measured was −6.6°C. The
relative humidity measured at the same time was 98.6%. We used these values as
external boundary conditions.
Fig 2 Computational domain
The ventilation system supplies 10.7 m3 s−1 of conditioned
air. A CFD computation involves an iterative process. At the end of each iteration
we adjusted the supply temperature so that the computation achieved the measured
average temperature in the warehouse (20.5°C). Then we adjusted the supply
relative humidity so that the computation achieved the measured average relative
humidity (38.3%). At the end of the computation the supply conditions were 26.8°C
and 29.0% RH.
In winter the moisture content of the outside air is very low compared with the
moisture content in the warehouse. At the outside conditions, −6.6°C, 98.6% RH,
the moisture content is 2.12 g kg−1 dry air and at the average inside
conditions, 20.5°C, 38.3% RH, the moisture content is 5.73 g kg−1 dry
air. Consequently, we can easily identify the location of the leakage air in the
warehouse by the drop in moisture content.
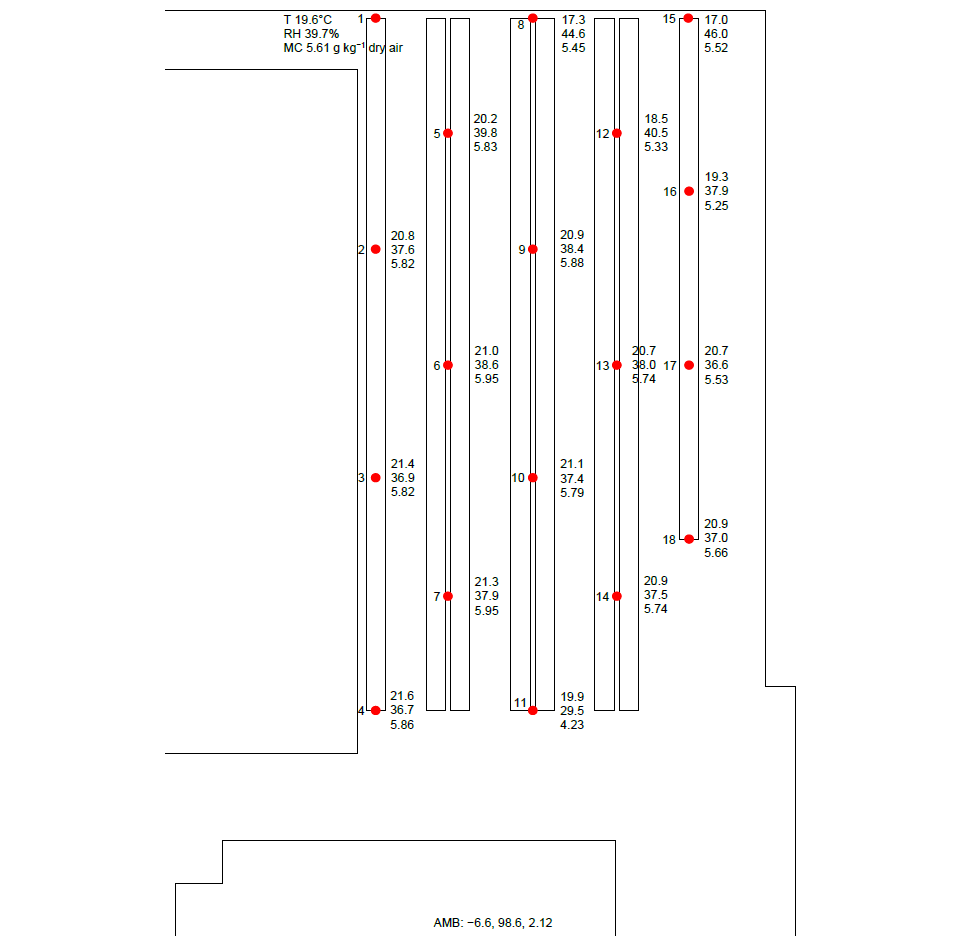
For the measurement survey the warehouse contained 54 T/RH loggers arranged in
columns of three at the top, middle and bottom of the storage racks. Figure 3
shows the location of each column and the readings of the bottom loggers when the
outside conditions are −6.6°C, 98.6% RH. We have also added the moisture content,
calculated from the measured T and RH values. The highest temperatures are
recorded in the storage rack closest to the office block and the temperature falls
gradually towards the north and east corners of the warehouse. The average
moisture content over the bottom loggers is 5.61 g kg−1 dry air. At
location 11 in Figure 3 the moisture content falls to its lowest value of
4.23 g kg−1 dry air. We can show that the warehouse air must contain
22% by volume of outside air for the moisture content to fall from the average
value to this value. Location 11 is the closest to the northeast wall and the
roller-shutter doors where the draughts were felt.
Fig 3 Measured T, RH and moisture content
for the bottom loggers
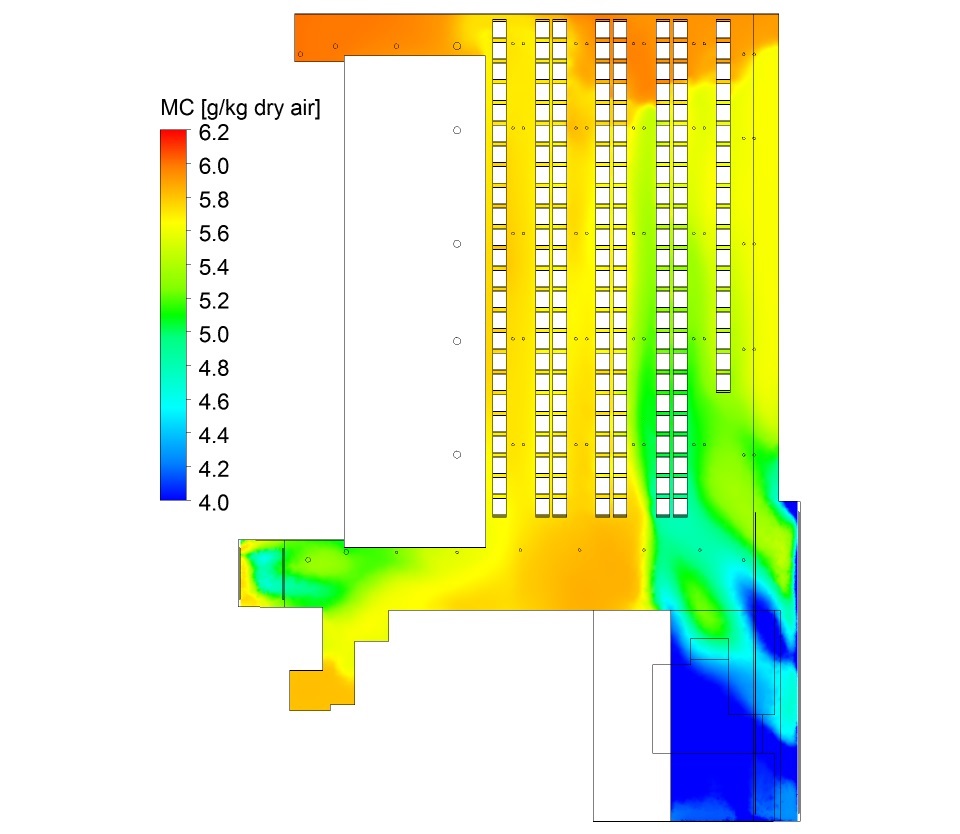
Figures 4 and 5 give the temperature and moisture content computed by the CFD model
in the same plane as the bottom loggers. A large swathe of cold air can be seen
moving from the east corner of the warehouse towards the storage racks. However,
the lowest moisture content in any of the racks (5.35 g kg−1 dry air)
occurs at the end of the second rack from the office block, 4 metres from
location 11. The computation is consistent with the measurements, but more of the
infiltration flows across the front of the racks and less down the aisles between
the racks. The average computed moisture content over the bottom loggers is
5.71 g kg−1 dry air, which compares well with the average measured
value of 5.61 g kg−1 dry air. From these comparisons, we can conclude
that we have specified the location and amount of infiltration reasonably well and
that the CFD model provides an accurate representation of the temperature and
humidity when the existing ventilation system is opposed by the infiltration.
Fig 4 Computed temperature in the plane of
the bottom loggers for the existing air-conditioning system
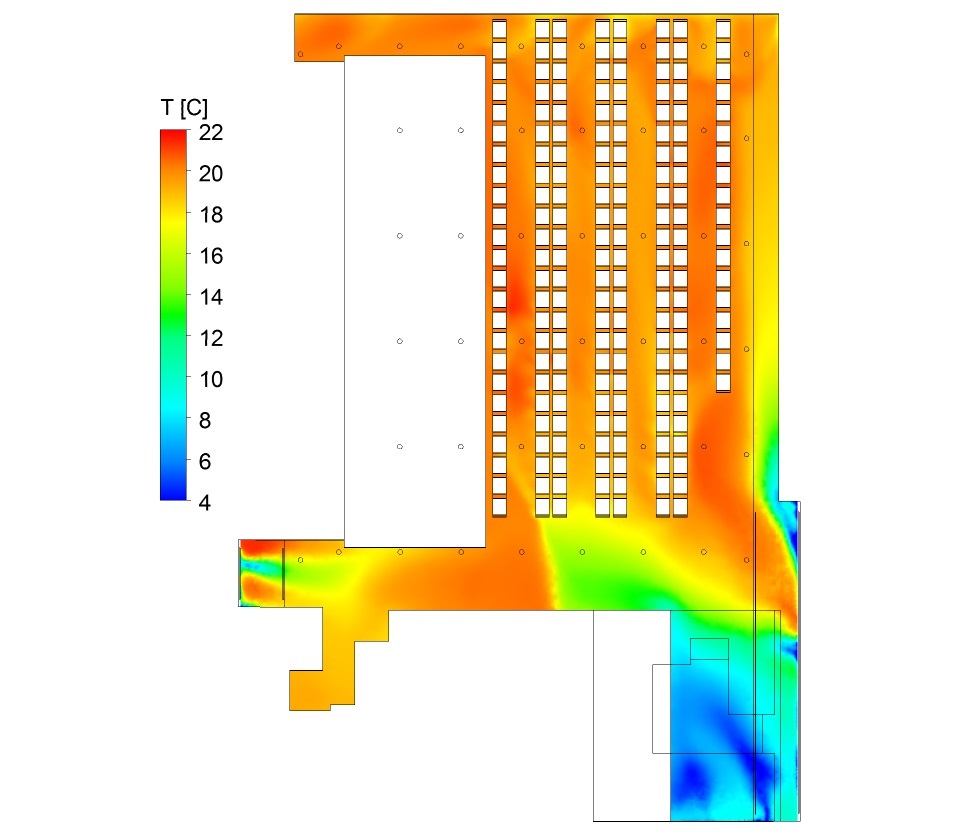
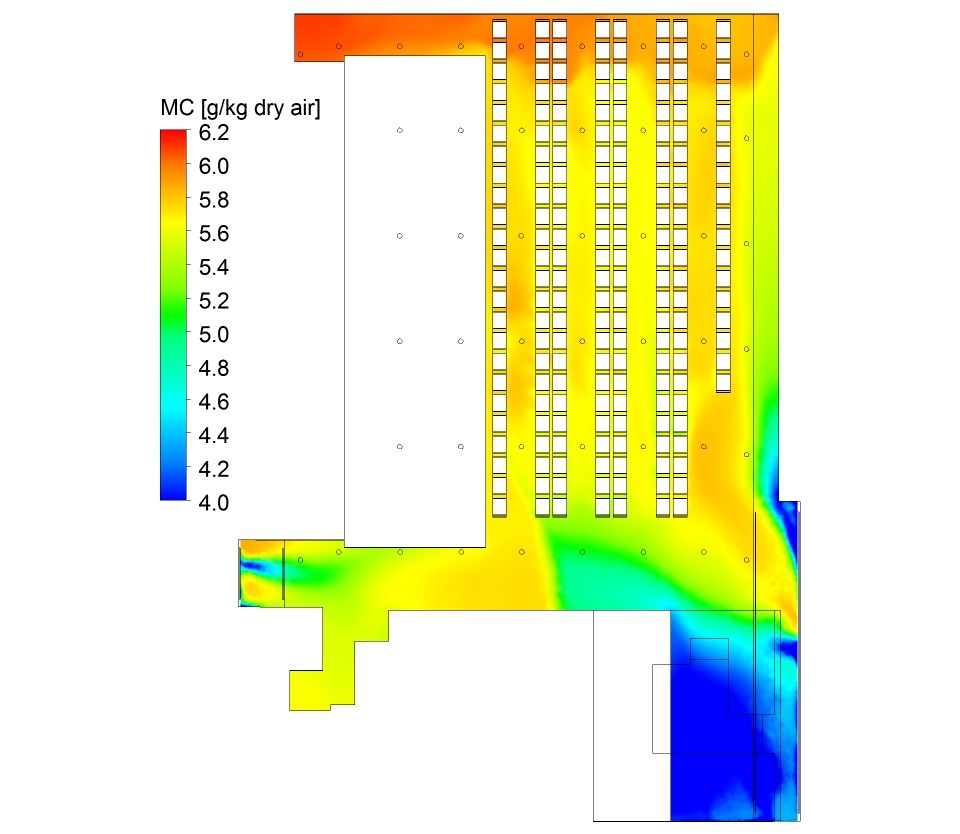
Fig 5 Computed moisture content in the plane
of the bottom loggers for the existing air-conditioning system
We used the validated CFD model to determine how a proposed new ventilation system
would perform when faced with the same infiltration. The proposed new system
consists of 62 high-level diffusers supplying 10.7 m3 s−1
of conditioned air. At the end of the CFD computation the supply conditions were
27.3°C and 28.2% RH. Figures 6 and 7 show the computed temperature and moisture
content in the same plane as the bottom loggers. Comparing Figures 4 and 6 shows
that the temperature around the storage racks is less uniform with the new system,
and especially around the racks on the northeast side of the warehouse. Comparing
Figures 5 and 7 shows that more of the cold air is able to pass between the racks
than before. In fact, there is a build-up of temperature in the north corner of
the warehouse as warm air between the racks is pushed back by the flow of cold
air. The average measured temperature over the bottom loggers is 20.2°C. When the
existing system is replaced with the new system the average computed temperature
falls from 19.9°C to 19.2°C because warm air is displaced upwards by the cold air.
Clearly, the new system is less effective at dispersing the infiltration than the
existing system. In fact, it is difficult to imagine any high-level ventilation
system being able to disperse the cold air moving along the floor and we concluded
that the warehouse must be sealed before deciding whether to replace the existing
air-conditioning system with a new one.
Fig 6 Computed temperature in the plane of
the bottom loggers for the new air-conditioning system
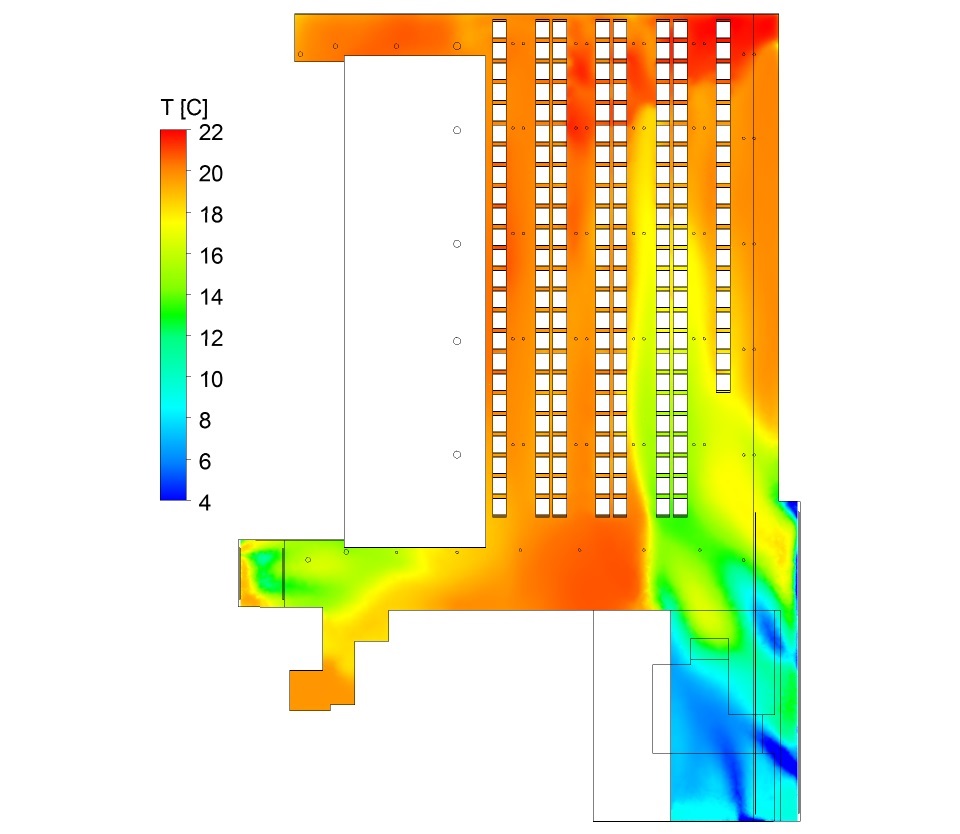
Fig 7 Computed moisture content in the plane
of the bottom loggers for the new air-conditioning system
The benefits
The programme of work by Atkinson Science showed that the warehouse must be sealed
along its east side before any decision is made about replacing the
air-conditioning system. It is possible that the existing system will perform
perfectly well once the warehouse is sealed and that it would be more
cost-effective to undertake some simple remedial work on the system than to
replace it with a completely new system.