Case Study – Fume Dispersion from the Malta Biosciences Park
The challenge
A new biosciences park is being planned for the island of Malta, to be located 3 km
inland from Valetta on the east coast. Initially there will be three buildings on
the park: LS1, a six-storey tower block; LS2, a two-storey building around the
north and east sides of LS1; and LS3, a two-storey building to the north of LS2.
Building LS2 will have seven stacks on its roof that will discharge fumes to the
atmosphere. The fumes must disperse safely into the atmosphere and not pose a
hazard to the occupants of other buildings or pedestrians. When the wind is from
the north, LS1 is directly in the path of the fumes from the stacks. Even so, the
fumes must be diluted at least fifty times before they come into contact with LS1.
The solution
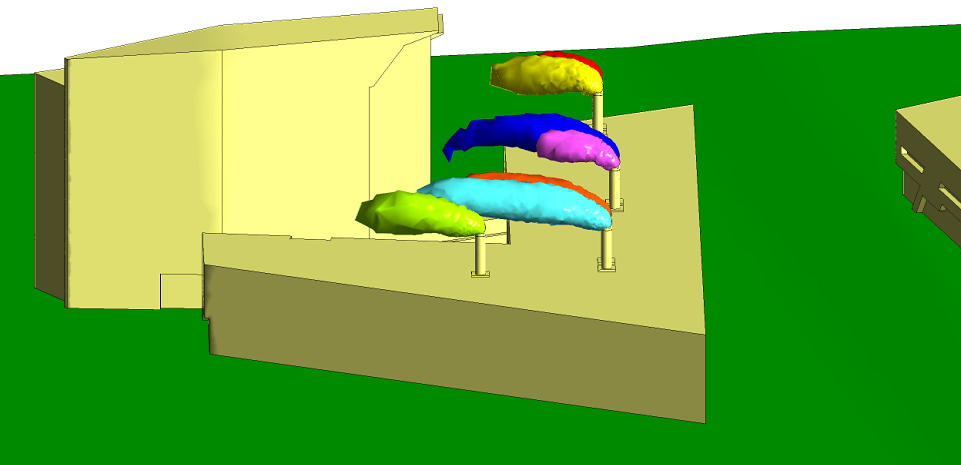
Atkinson Science used computational fluid dynamics (CFD) to determine whether the
stacks would produce the necessary number of dilutions at wind conditions
encountered on Malta. The CFD model is shown in Figure 1. Figure 2 shows a
close-up of the stacks, which are numbered 1 to 7. Apart from stack no. 4, all the
stacks contain four vents. Stack no. 4 contains two vents. Figure 3 shows a
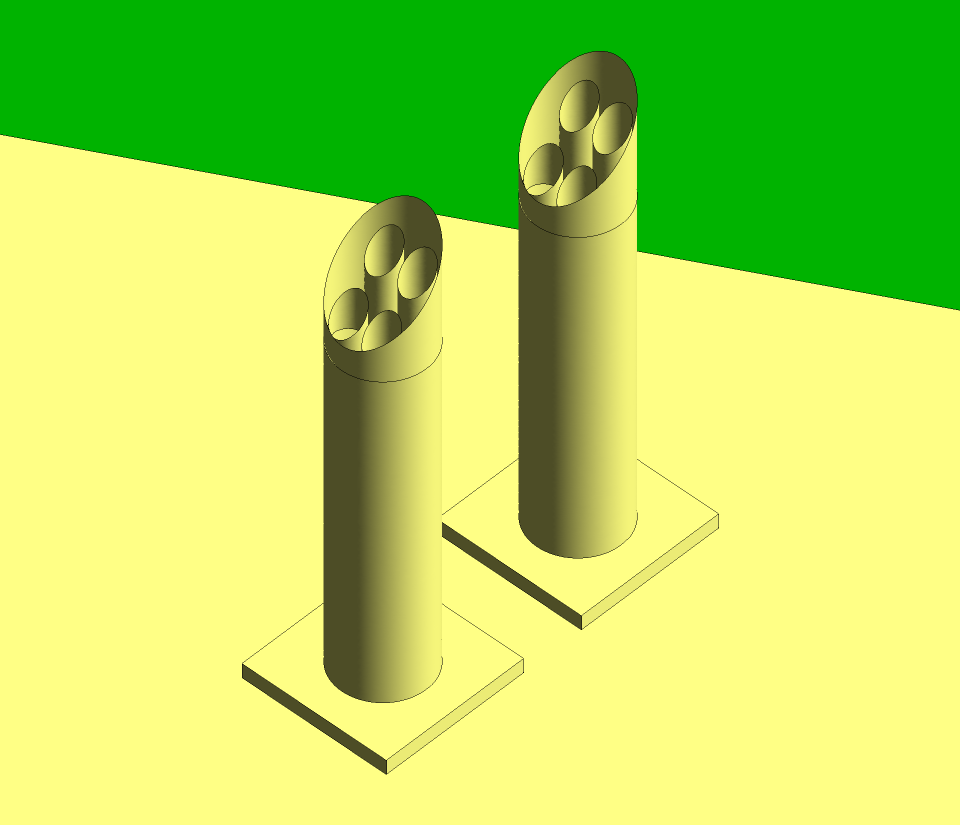
close-up of stacks 1 and 2. The stacks were created separately and then imported
into the main CFD model at the appropriate locations. We used the CFD model to
calculate the dispersion of the fumes for a wind speed of 0.5 m s−1
(light air on the Beaufort scale) and a wind speed of 2.5 m s−1 (a
light breeze on the Beaufort scale) with the wind direction every 30° from
north.
Fig 1 CFD model
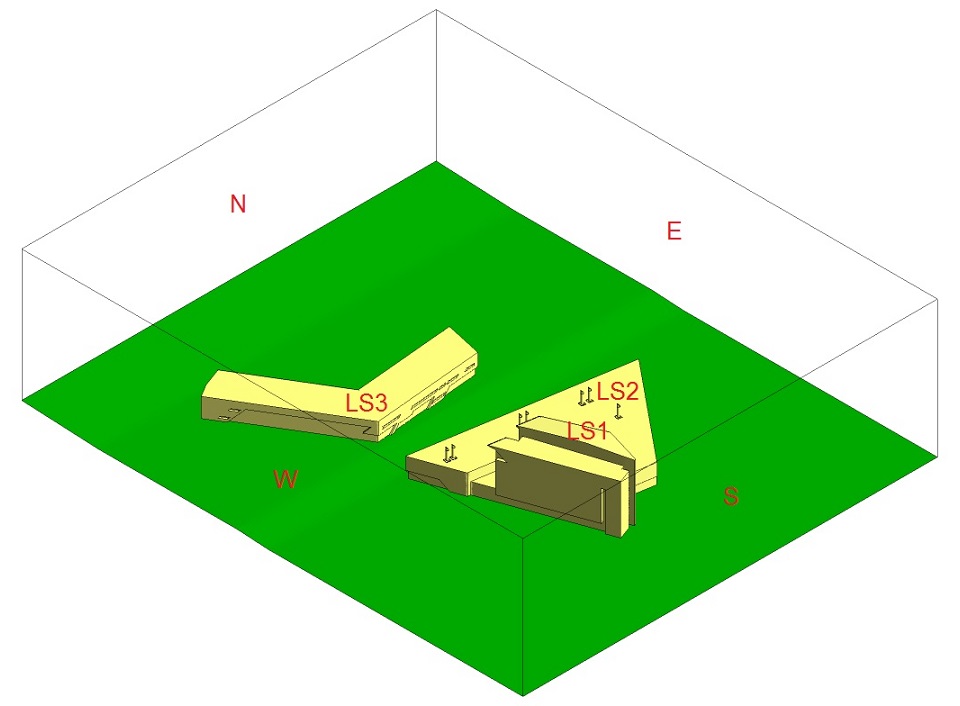
Fig 2 Numbering of the stacks
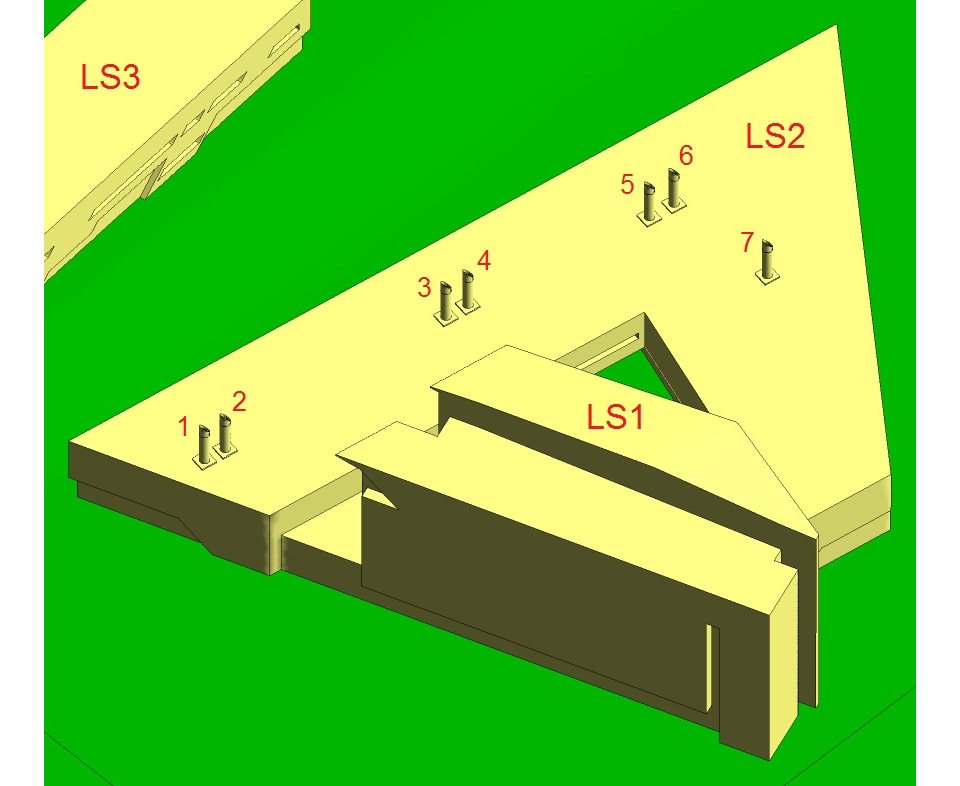
Fig 3 Close-up of the stacks
In a light wind the pollutants from a stack will follow a high trajectory but will
disperse slowly, whereas in a heavy wind the pollutants will follow a low
trajectory but will disperse rapidly. Figure 4 shows isosurfaces representing 50
dilutions for each of the stacks when the wind is 30° from north
(approximately NNE) at 0.5 m s−1. The isosurfaces for stacks 3 and 4
(coloured dark blue and magenta, respectively) envelope the upper storeys of
building LS1. In fact, the fumes from stack 3 undergo only 20 dilutions before
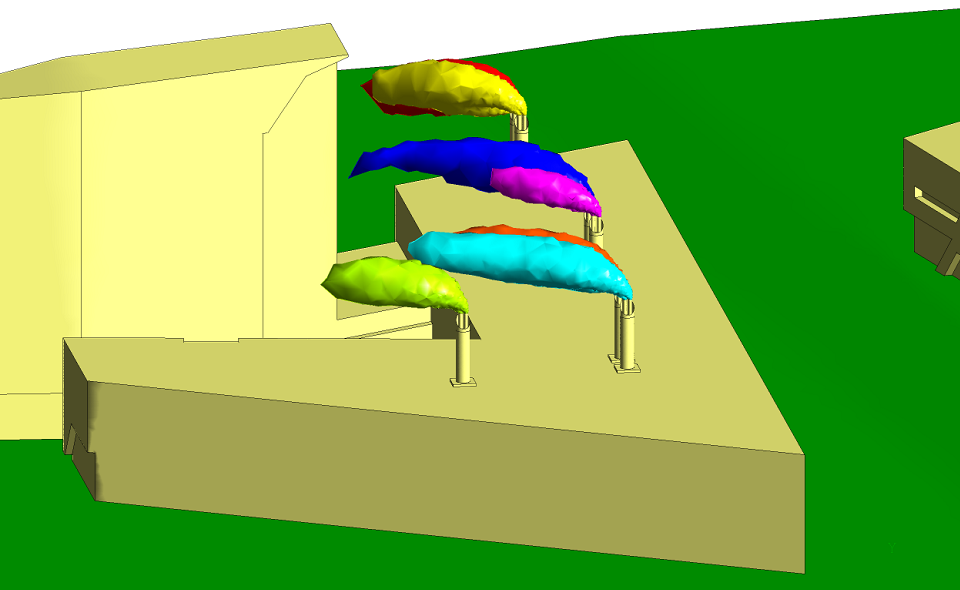
they reach the building – far fewer than required. Figure 5 shows isosurfaces
representing 50 dilutions with the wind from the same direction but at
2.5 m s−1. Although the fumes follow a lower trajectory, they
disperse much faster and so the isosurfaces do not reach LS1.
Fig 4 Isosurfaces representing 50 dilutions. Wind from NNE at 0.5 m s−1
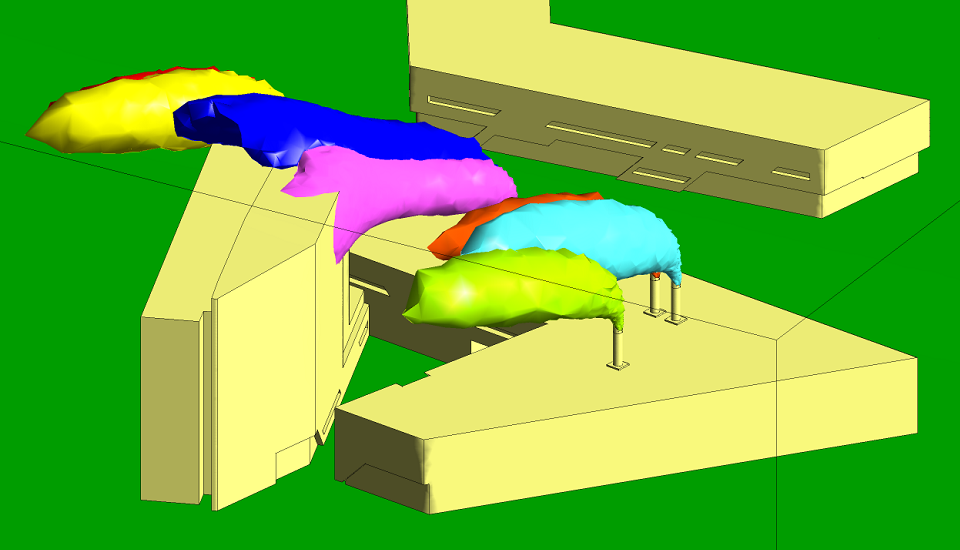
Fig 5 Isosurfaces representing 50 dilutions. Wind from NNE at 2.5 m s−1
The stacks under-perform at low wind speed. To improve the performance we can
increase the exit speed of the fumes so they follow a higher trajectory. We
created new stacks as shown in Figure 6. The vents have less than half the exit
area of the original vents, so the exit speed is more than doubled.
Fig 6 Close-up of the new stacks
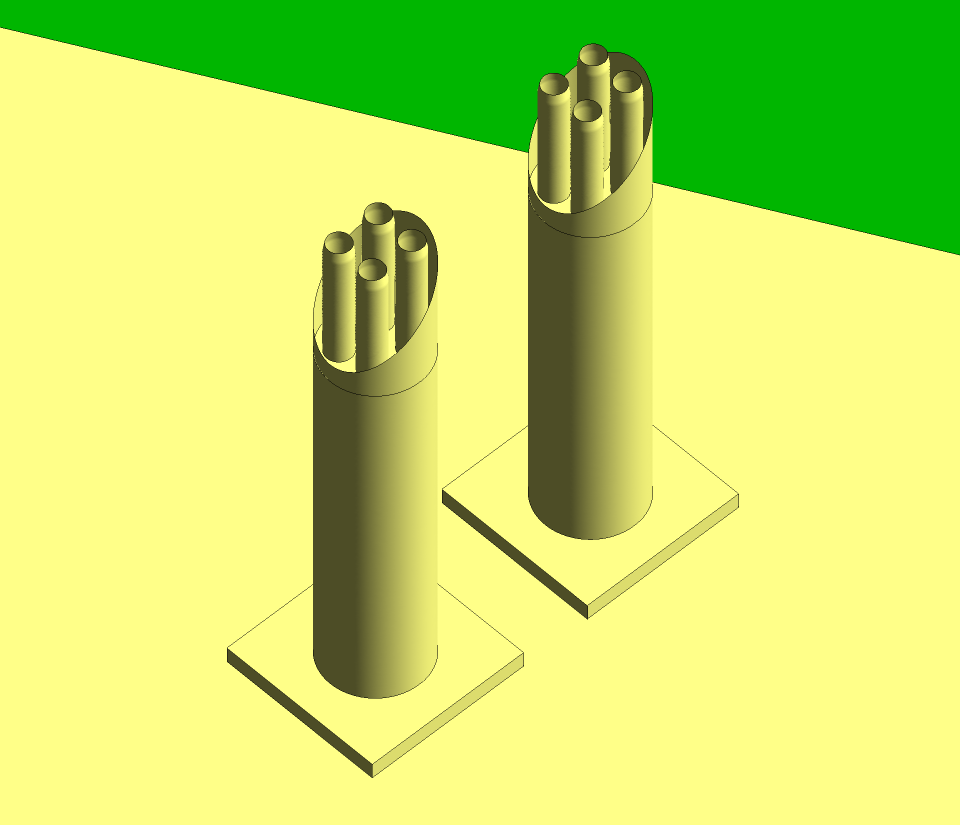
Figure 7 shows isosurfaces representing 50 dilutions for each of the stacks for a
NNE wind at 0.5 m s−1. The isosurfaces for stacks 3 and 4 now rise
clear of building LS1. Figure 8 shows the same isosurfaces when the wind is at
2.5 m s−1. The fumes follow a lower trajectory but disperse much
faster and so the isosurfaces do not reach LS1.
Fig 7 Isosurfaces representing 50 dilutions. Wind from NNE at 0.5 m s−1. New stacks
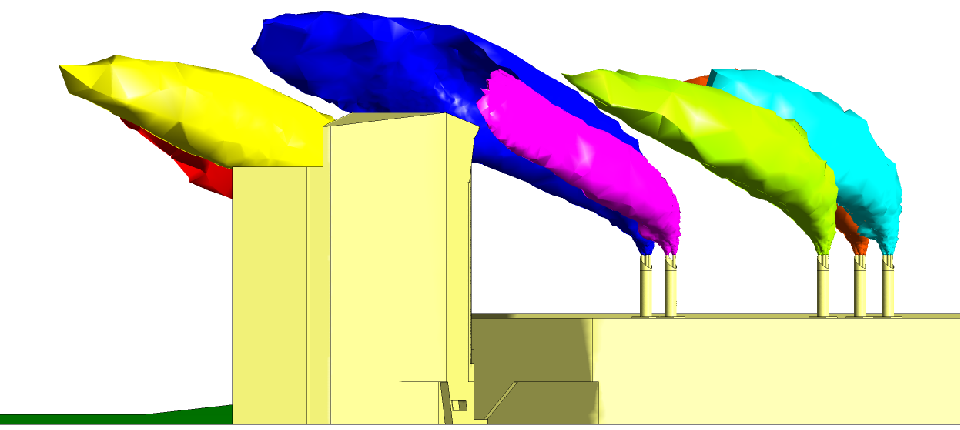
Fig 8 Isosurfaces representing 50 dilutions. Wind from NNE at 2.5 m s−1. New stacks
The benefits
Atkinson Science used CFD to show that the stacks on LS2 do not disperse the fumes
sufficiently at low wind speed. However, we demonstrated to the client how the
stacks can be modified to achieve the required number of dilutions.